> For the complete documentation index, see [llms.txt](https://docs.linuxfoundation.org/lfx/llms.txt). Markdown versions of documentation pages are available by appending `.md` to page URLs; this page is available as [Markdown](https://docs.linuxfoundation.org/lfx/organization-dashboard/events-insights/speaker-insights.md).
# Speaker Insights
**Speaker Insights Tab**
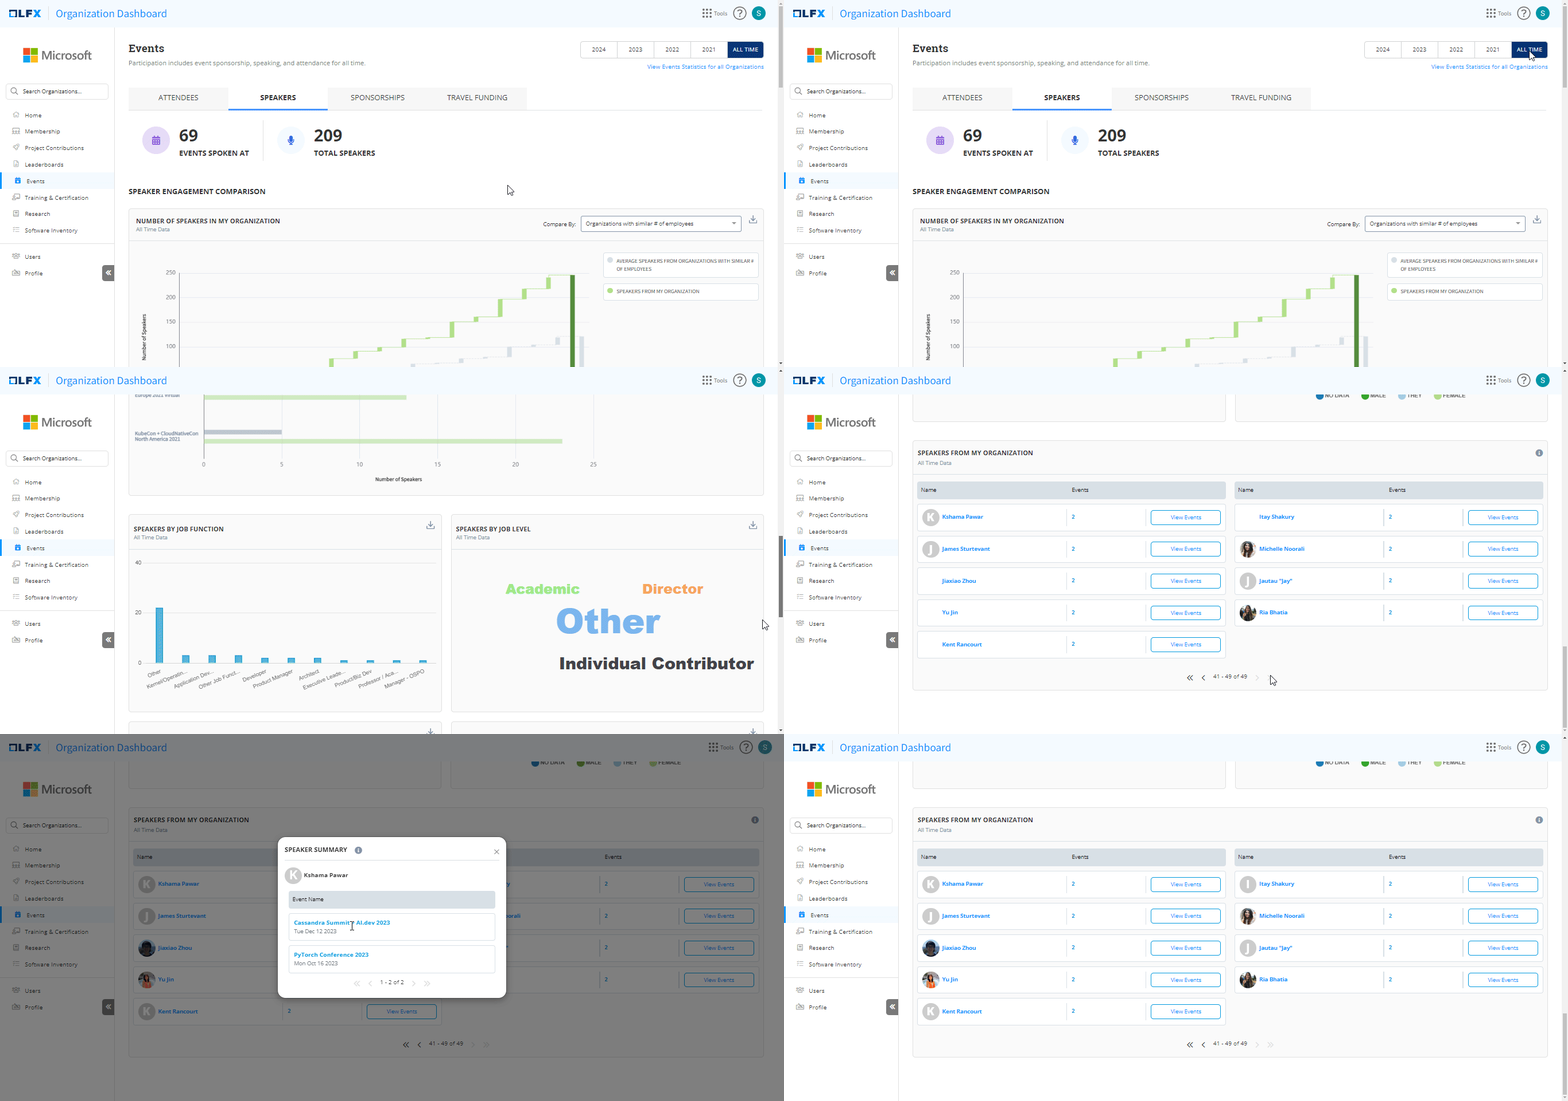
The Speaker Insights tab provides a comprehensive overview of speakers who have participated in various events from your organization. This feature allows you to extract valuable information about your speakers, compare them with other organizations, and gain insights into their demographics and job functions.
**Available Data and Visualizations**
The following data and visualizations are available in the Speaker Insights tab:
{% hint style="info" %}
The Metrics and charts to show your organization's data are the same as the [Attendees Dashboard](/lfx/organization-dashboard/events-insights/attendee-insights.md).
{% endhint %}
#### Speaker Widget:
Displays a list of speakers from your organization, including their names, job functions, and event participation details.
#### Comparison Bar Graph
* Compare the number of speakers from your organization with other organizations of similar size
* Provides a visual representation of the speaker count and percentage
* For more information, refer [Attendee Insights](#comparison-of-speakers-between-your-organization-and-other-organization).
#### Top 10 Events Attended by Speakers
* Compares the top 10 events attended by speakers from your organization with speakers from other organizations
* Displays a horizontal bar graph showing the event count and percentage
#### Job Function Bar Graph
* Displays a bar graph showing the job functions of speakers from your organization
* Provides a visual representation of the job function distribution
#### Job Level Word Cloud
* Displays a word cloud chart showing the job levels of speakers from your organization
* Highlights the most common job levels
#### Regional and Country Breakdown
* This heat map on a world geolocation graph represents the geographic distribution of attendees from your organization who participated in open source events. The graph displays a heat map of the world, with darker colors indicating a higher concentration of attendees from your organization in a particular region.
#### Gender Distribution
* Displays a donut chart showing the gender distribution of speakers from your organization
* Provides a visual representation of the gender breakdown
#### List of Speakers
* Displays a list of speakers from your organization, including their names, job functions, and event participation details
By utilizing the Speaker Insights tab, you can gain valuable insights into your speakers' demographics, job functions, and event participation, allowing you to make informed decisions and optimize your organization's speaker engagement strategy.
---
# Agent Instructions
This documentation is published with GitBook. GitBook is the documentation platform designed so that both humans and AI agents can read, navigate, and reason over technical content effectively. Learn more at gitbook.com.
## Querying This Documentation
If you need additional information that is not directly available in this page, you can query the documentation dynamically by asking a question.
Perform an HTTP GET request on the current page URL with the `ask` query parameter, and the optional `goal` query parameter:
```
GET https://docs.linuxfoundation.org/lfx/organization-dashboard/events-insights/speaker-insights.md?ask=&goal=
```
`ask` is the immediate question: it should be specific, self-contained, and written in natural language.
`goal` is optional and describes the broader end goal you are ultimately trying to accomplish on behalf of the user. GitBook uses it to tailor the answer towards what is most useful for that goal.
The response will contain a direct answer to the question and relevant excerpts and sources from the documentation.
Use this mechanism when the answer is not explicitly present in the current page, you need clarification or additional context, or you want to retrieve related documentation sections.